SFS Insights: Strong First Nine Months Could Signal More Gains Ahead
September has bucked its historical trend with its 1.2% gain month to date, compared to an average decline of 0.7% (since 1950). The past four Septembers (-4.9%, -9.3%, -4.8%, and - 3.9%) were particularly rough.
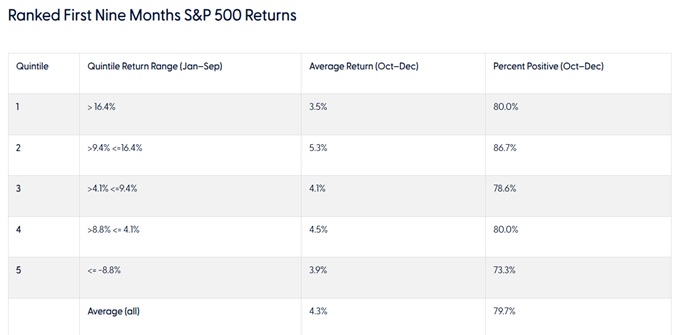
This year has been one for the history books, as the S&P 500 has secured 39 new all-time highs since the start of the new year. Most recently, on September 19, the S&P 500 climbed over the 5,700 mark following the Federal Reserve’s (Fed) jumbo half-percent rate cut, marking the first cut in four years. While it’s no secret that September is historically the worst month for stock performance, when the S&P 500 notches a new high during September, the index produced positive results in the fourth quarter 91.3% of the time.
While historical trends point to a solid likelihood of positive returns for the S&P 500 in the final three months of 2024, Fed policy decisions, a much-anticipated Presidential election, and fourth quarter earnings loom on the horizon as major market catalysts.

Source: LPL Research, Bloomberg, 9/23/24 Disclosures: All indexes are unmanaged and cannot be invested in directly. Past performance is no guarantee of future results. The Standard & Poor’s 500 Index is a capitalization weighted index of 500 stocks designed to measure performance of the broad domestic economy through changes in the aggregate market value of 500 stocks representing all major industries.


